Sunday, January 9, 2022

Portfolio allocation

Our sector allocation is currently as shown in the picture: 


The backbone of the portfolio is technology. The related sectors total to 46% of portfolio. This is the same aggregate allocation as in the previous year across the tech sectors. There were changes in individual sectors and companies, but they seem to even out on this level.

Industrial goods & services is our second largest bet with financials trailing very close. Berkshire Hathaway is counted 50/50 for both.

Our top 5 stock positions currently are:

  1. Berkshire Hathaway (USA)
  2. Nokia (Finland)
  3. Metso Outotec (Finland)
  4. Verkkokauppa.com (Finland)
  5. Siili Solutions (Finland)


Compared to year go Berkshire Hathaway and Nokia have climbed one position upwards while Metso Outotec fell from 1st place to 3rd largely because the two previously mentioned performed much better in 2021. Since I trimmed our semiconductor positions smaller, Micron nor any other players are visible among top 5. Verkkokauppa.com continues to be the 4th largest position and Siili Solutions raised to be the 5th.

Especially the top 3 positions are significant. They make up 34% of the entire portfolio while top 10 is 67% of the portfolio, which contains all told 23 stocks from Finland and USA.

Saturday, January 8, 2022

Back to black - in a big way

On March 21st, 2020 near the bottom of the COVID19-induced market crash, I wrote a blog post stating essentially that

  • I don't believe in timing the market. 
  • This included pledge of not jumping out of market when it starts to look bad (exception being a clear bubble)
  • As result of sticking with this I lost all gains from previous 3 years
  • As my next steps, I told that I was going to continue to ignore daily swings of the market and focus on the quality and financial condition of the corporations we continue to be invested in.

Well, you know what happened. A very rapid correction upwards and then some.


Both our pre-crash and post-crash portfolios were riskier than the portfolio than the Dow Jones Global Index (W1DOW) shown in the figure above (yellow line). The post-crash portfolio being more risky than the pre-crash one because I deliberately shifted balance to the most risky assets in portfolio.

And when I say risky, I mean high beta. Not some low quality hacks, but high quality corporations that just happen to amplify whatever the general market direction is.

Because of that, I emphasized that I make these investments with 10-30 years time horizon. Because it could have gone the other way too. In which case I would have been ready to sit on that portfolio for the said time.

After significantly beating the index, I have rotated back to companies that are low beta and hence the portfolio is likely going to behave close to market.

Let's be clear: Getting above average return was not due to some skill I possess in picking overperforming stocks. It is largely because I took more risk (than the index contained) and was compensated for taking that risk because the market moved the right way and the high beta stocks amplified the market move.

Where the stock picking comes in is to have a portfolio that you do not have to follow every day. Not even every week to get a good night sleep.

Sunday, January 2, 2022

Happy New Year 2022!

Happy New Year 2022!

Last year was the busiest I have ever had. Thus, did not have time to post. But also did very little in terms of change in portfolio. There was no need because we had already rotated in 2020-2021 heavily towards value from the hot stocks.

I maintain my view that

  • some of the stocks are grossly overpriced
  • on the other hand, one can find still reasonably priced stocks

Despite the flight to value, we managed to have the best year ever in terms of absolute gains. In terms of year-on-year growth the year was second best (only second to 2019) at 27,2%.

Relative to our benchmark investment the portfolio gained 1,1% extra.

 Portfolio performance 2009-2021 (chart).


Portfolio performance 2009-2021 (table).


In terms of cumulative yearly gains, we are now 76,3% above the benchmark investment. 

All five best performing stocks are listed in Finland:

  • Nokia +95,8%
  • Nordea +60,3%
  • Fortum +37,0%
  • Capman +31,1%
  • F-Secure +29,5%

From our U.S portfolio, Berkshire Hathaway, which is also by far our largest single position in any market, gained 29% when measured in euros.

Last year, I started with wishing that the year 2021 would bring the end of the Coronavirus pandemic globally. Did not happen.

Thus, extending that wish for 2022.


Sunday, February 21, 2021

Portfolio update: Continuing 91% invested in stocks

We are currently 91% invested in stocks. Rest is largely in cash and while it is near same level as previously disclosed in October 2020, there has been some rotation as lucrative opportunities presented itself in e.g. Nokia. We had increased the stake long before the Wallstreetbets induced rally and used that opportunity to offload some of the position.

Few other positions in smaller Finnish stocks have been trimmed as they presented some near vertical climb and ended in my opinion to price level that can not be justified by fundamentals. Well, that's really a lot broader challenge now in the stock market as market as aggregate goes up induced by .. well, I guess mostly by past positive momentum. 

Top 10 stocks stand now at above 70% of portfolio already despite some being trimmed down so that continues to spell out as decent company risks. The trick with most of those positions though is that they carry currently most of our unrealized profits and reducing them mean Finnish tax authority takes 30-32%. As long as those positions can be justified by fundamentals - even if need to stretch a bit - I think we are better of just continuing long.

Sector allocation is as shown in the picture: 


46% of the portfolio is allocated to technology related sectors and that continues to be the backbone of the portfolio. We do like IT/Tech and would like to accumulate even more, but not with any price.

Industrial goods & services is our second largest bet (I count 50% of Berkshire Hathaway into this btw). 

Our top 5 stock positions currently are:

  • Metso Outotec (Finland)
  • Berkshire Hathaway (USA)
  • Nokia (Finland)
  • Verkkokauppa.com (Finland)
  • Micron (USA)


Sunday, January 3, 2021

2020: The Odd Year

Happy New Year 2021!

May this year bring be the end of the Coronavirus globally.

The year 2020 was altogether odd. In terms of investments it seems that Wall Street and Main Street are (again) drifting apart. After the COVID-induced market crash of early 2020, the market has rebounded and then some. Those of us with exposure to technology stocks have done well. However, it does not feel as good as if the same would apply the economy at large. 

Some of the hottest stocks have gone through the roof and continued to climb further from the point where I considered them being extremely expensive (like NVIDIA in July). Still, I do not consider starting rotation from NASDAQ darlings to more dull main street names being a mistake in the long run. There are signs of gross overpricing if not bubble in some tech sector names similarly to the great tech bubble 1999-2000. Ever crazier valuations are justified with questionable logic.

If you assume low enough weighted average cost of capital or perhaps some growth to perpetuity, then you can pretty much justify any valuation. Divide by zero yields infinitely valuable stock.

Still, you can find also reasonably priced stocks even in the technology sector, but usually they come with a short or medium term challenge (like Nokia or Intel). Outside of tech sector it gets easier and you may not even have to discount for any headwind. For the sectors that were hit hardest (travel, restaurants, events etc.) it will take long time to recover.

The year 2020 ended up to be the best year we have ever had in stock markets in terms of 
gains relative to our benchmark investment* - passive index investing (+11,8%).


 Portfolio performance 2009-2020 (chart).


Portfolio performance 2009-2020 (table).


In terms of cumulative yearly gains, we are now 57,2% above the benchmark investment. 

Our best performing stocks this time included stocks both from Finland and USA. In Finland it was in particular the small and mid caps that did well and in USA our semiconductor plays delivered (especially Micron and NVIDIA until we let it go in the middle of the year). 

In the next post, I will cover our starting allocation for 2020. As usual, we continue to be almost fully invested into stocks. However, rotation towards lower risk stocks started in 2020 and is expected to continue during 2021.

*) The "benchmark investment" is an imaginary passive ETF that closely tracks the performance of MSCI all country world (ACWI) index in euros (more info here). 

Sunday, October 4, 2020

Portfolio update: Cash position increased

Our cash position is currently at 10% and has not been this large for years. Most of our sales recently have been kept as cash instead of reinvesting to another stock. Pandemic, US elections, Brexit etc. aside -  it is increasingly hard to find stocks that are reasonably priced. That's the bottom line. Another reason is that we start to be massively long in a few stocks I particularly like. We have roundabout 20 stocks in portfolio so 5% would be an even stake. But that's not how most portfolios are and ours even less so. Top 10 stock stand at close to 70% of portfolio already so that starts to spell out as decent company risks.

Sector allocation is as shown in the picture:


As an aggregate different technologies and IT related sectors are close to 40% and that is the backbone of the portfolio. We do like IT/Tech and would like to accumulate even more, but not with any price.

Financials is our second largest bet. 

Our top 5 stock positions currently are:

  • Berkshire Hathaway (USA)
  • Metso Outotec (Finland)
  • Nokia (Finland)
  • Intel (USA)
  • Verkkokauppa.com (Finland)

Sunday, July 12, 2020

Last N of FANGMAN out

We have sold all of our NVIDIA position and no longer have any positions in the hot dominant technology stocks dubbed as "FANGMAN". After selling Apple, NVIDIA was our last stock in this category. However, it rose to price level where I felt it was no longer in touch with realities.

The last N in "FANGMAN" has currently forward P/E valuation* of 42. With that it falls short only to ridiculous valuations of the other N (Netflix) at 64 and Amazon at 85.

While the valuations of the rest are also on the rich side, they are still more reasonable:
  • Microsoft 34
  • Alphabet (Google) 28
  • Apple 26
  • Facebook 25
For the first time in a very long time, we left the proceeds as cash waiting for future opportunities. 
Market overall seems a bit expensive compared to no-so-great economical situation and future projections. 

*Forward P/E valuations from Finwiz.com

Saturday, March 28, 2020

Berkshire back in portfolio for the 3rd time

In the depths of 2008-2009 financial crisis, we bought Berkshire Hathaway (NYSE: BRK.B) for the first time. The second time was approx. 3 years ago when P/E ratio was near multi-year lows and P/B was approaching 1,2x book value. That was the level  Warren Buffett had indicated to be the trigger for the formal share buyback program at the time.

Berkshire has been lately trading close to 1x book value. However, it has to be also taken into account that majority of Berkshire's common stocks have been beaten badly and the insurance industry is expected to take quite a hit.

Still, I felt comfortable raising Berkshire from zero allocation to pole position (largest holding). In my eyes there are few stocks better than that to own at times like these. I really like the management / investing style of Warren Buffett. It has taken Berkshire where it is today. I also like the fact that they had insane amount of cash available when the stock market tanked.

As Sean Weston wrote in his recent article about Berkshire in Seeking Alpha "shares trading this close to book value is a truly rare event, taking place only on two other brief occasions this century".

Sven Carlin examines in his recent article this attractive opportunity from the viewpoint of P/E when the Berkshire’s $124 billion cash pilecash have been backed out from the price of the company. The result of his analysis: Based on 2019 earnings and deducting the cash, the price to earnings ratio is ~10.

A word of warning: Berkshire earnings (and thus P/E) is very volatile as they use mark-to-market for their stock portfolio. Also, both of the above analysis have to be taken from the view point of long term (i.e. where the profitability / book value will likely return in 3-5 years).

Yet, we like.

Disclosure: Author is Long Berkshire Hathaway.

Sunday, March 22, 2020

Changes in top 5 positions

Our top 5 positions on January 1st were:


  1. Apple (USA)
  2. Western Digital (USA)
  3. Micron (USA)
  4. UPM (Finland)
  5. NVIDIA (USA)


The biggest changes have been (done in the midst of market crash):

- Sold Apple stock (all of them)
- Trimmed down Western Digital
+ Acquired shares in Berkshire Hathaway
+ Increased heavily our position in Nokia
+ Acquired shares in Broadcom


At the moment top 5 positions are as follows:


  1. Berkshire Hathaway (USA)
  2. Nokia (Finland)
  3. UPM (Finland)
  4. Intel (USA)
  5. NVIDIA (USA)

Our largest sector allocation continues to be semiconductor industry by a wide margin to the next.

Saturday, March 21, 2020

This is what being long in stock market at times like these look like

I have said previously that I don't believe in timing the market. This includes pledge of not jumping out of market when it starts to look bad. Only exception to this rule would be a clear stock market bubble (i.e. valuations become crazy like for tech stocks back in 1999).

Well,
This is what following these rules have looked like recently:


That's value of our largest broker account over 3 years. As you can see the recent crash has taken the aggregate value of all stocks in that portflio back to levels seen at end of 2018 and early 2017.

Some are still above 100% the buy price, but some have sank 50% of the purchase price. And the rest are in between these extremes.

Whatever time I have currently to spare to following market (and that's very little considering the exceptional situation we all are exposed to), I spend not focused on the daily swings of the market, but to the quality and financial condition of the corporations we continue to be invested in.

As Benjamin Graham has said and lately most famously echoed by Warren Buffett:

“In the short run, the market is a voting machine but in the long run, it is a weighing machine.”

My experience with stock market crashes like this, 1999, 2008 and many more smaller ones is that market will overshoot both directions and it's close to impossible to find the top or the bottom. This is not to say I haven't made a lot of changes to the portfolio - I have. The point is that I make sure we are 90-100% exposed at all times because one day this craziness ends and markets correct very rapidly. We have stocks where the daily swings to both directions might exceed 15%. Missing few upward swings would be really bad especially now that we have taken the ride all the way down.

Rising tide will eventually lift all boats. The trick right now is to stay away from the boats that might sink and stay invested in the ones that will be there also very likely in 10-30 years.

Good health to you and your families and friends.
Stay safe.

Monday, January 6, 2020

Portfolio on January 1st

Our starting portfolio allocation for year 2020 was as follows:


  • Stocks 96,7%
  • Gold 1,0%
  • Cash 2,3%

No bonds. We simply substitute bonds with quality dividend payers in our portfolio. The cash position was temporary and related to transactions near change of the year.

No big structural changes were made during 2019 (certainly not compared to what was done during 2018).


Geographical Allocation (stocks):

  • Europe 57,3%
  • North America 42,7%
  • Emerging markets 0%

Actually, place of incorporation is pretty meaningless for most corporations we have invested in. Most operate and sell globally.


Sector Allocation is heavily tilted towards technology companies (IT & Technology 54,8%) and specifically to semiconductor sector (27,5%).


Sector Allocation (stocks)

The plan is to sell technology stocks early 2020 and invest into other sectors. As much as I like and believe in our technology portfolio it has come time to balance the portfolio.


Top 5 positions - in order of weight in portfolio:

  1. Apple (USA)
  2. Western Digital (USA)
  3. Micron (USA)
  4. UPM (Finland)
  5. NVIDIA (USA)

There is now 5 Finnish and 5 U.S companies  among largest 10 positions. The plan for 2020 is to increase weight and number of Finnish corporations at expense of the technology companies listed in the top 5.

Saturday, January 4, 2020

2019 - Best year ever

Happy New Year 2020!

The year 2019 ended up to be the best year we have ever had in stock markets in terms of

  • yearly gains (+36,2%)
  • gains relative to our benchmark investment* - passive index investing (+8,6%)
  • absolute gains 💰


Our best performing stocks were mainly from USA: Apple and most of our semiconductor plays (NVIDIA, Micron and Western Digital). Also some of our Finnish stocks did really well even though the Finnish market lagged most other markets with OMXH25 index returning "just" about 15%.


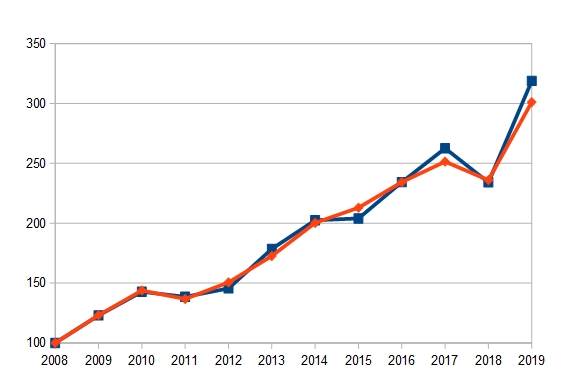
Portfolio performance 2009-2019.

Note: "Difference" column uses exact values as input rather than figures rounded to 1 decimal that are displayed.

In terms of cumulative yearly gains, we are now 17,7% above the benchmark investment. In the larger scheme of things (cumulative gains net of taxes 218,8% so far) this is very small deviation. Therefore, the key contributor to gains have been quite simply the decision to stay fully invested in the market.


Cumulative gains of our portfolio (blue line) vs. benchmark investment (red line). 31.12.2008 = 100.


As a new chart I have included the view to the absolute value of the portfolio so that the starting level on 31.12.2018 is scaled to 100. The orange bars single out money added to the portfolio each year. I would call this "the snowball view" as it gives very good idea on the benefits of compounding gains. 

It also puts in perspective our worst year (2018) and our best year (2019) so far. 

Portfolio absolute size (scaled 2008 = 100)

What we started with at end of 2008 (scaled to 100) has grown to 25-fold portfolio over the past 11 years.

Going into 2020 we continue to be almost 100% invested into stocks. I will cover our starting allocation in the next post.


*) The "benchmark investment" is an imaginary passive ETF that closely tracks the performance of MSCI all country world (ACWI) index in euros (more info here). 

Tuesday, October 29, 2019

Increased Nokia position

I have been trimming down our Nokia position during this year and after Q1 result wrote that
"the stock hasn't gone anywhere in last 5 years."

Well,
Now it has, but not to the direction investors would like to see:


Nokia Corporation share price in New York (USD) last 5 years.
Chart courtesy of StockCharts.com


Stock price is now below 5 year lows (in dollars) and to me it looked like a good opportunity to once again increase the position.

After Q1 I wrote:
"My key worry relates to very weak gross margin (GM) in the core business outside of patent/licensing business."

Networks unit GM was better than Q1, but still weak below 30% (and 5% lower than a year before).

Nokia Software GM improved 5% year on year and operating margin more than doubled so that's in a good track.

Nokia Technologies delivers - as always - stellar GM (97,8%) and OP (82,1%).

So, despite the very negative reaction in stock market, it's fair to say the business - especially Nokia Software unit - is going to the right direction.

I think the stock price movement was mostly due to Nokia lowering the expectation for the years 2019-2020 and beyond. Also, halting of quarterly paid dividend - even if just for Q3 and Q4 as announced - is an alarming signal.

All in all, Nokia management moved the ball one year forward stating "We expect that we will be able to progressively mitigate these issues over the course of next year.".

2020 was supposed to be a really good year, but now the payday has been moved forward and it doesn't look so sweet as it used to.

Nevertheless, the potential is there. It is not all bad.

The company just needs to get all the ducks properly in the row - especially in the Mobile Networks side of the house, which is the key to success in 5G.

Once again, I bet our money on Nokia board of directors and management making the right calls. The investors are now in need of clear positive signals.

At these levels there is already some safety of margin given e.g. some sum-of-parts analysis that I have seen (everyone can make their own estimate on the value of e.g. patent portfolio, Nokia Software and so forth). However, I would not be surprised if the fall in stock price would continue still.


Disclosure: We are long Nokia and do not consider to sell or buy in next 48 hours.

Monday, August 12, 2019

Portfolio update

We continue almost fully invested in stocks (~99%).

Our new sector allocation for stocks look like this (please click the picture to enlarge):


The main theme is "technology and related services" as nearly 50% of the portfolio is now allocated to companies providing high tech products and/or services (software and/or hardware) or supplying components to such companies (e.g. semiconductor manufacturers).

In terms of place of incorporation, more than 60% are based our home country (Finland, Europe) and the rest are based in USA. Majority of the corporations operate and sell globally.


Friday, August 9, 2019

Sold Berkshire Hathaway and trimmed down Nokia

I have made many changes in our portfolio.

Selling all shares in Berkshire Hathaway (NYSE: BRK.B) is the most significant move this year. The position grew to be our largest position from entry at $126,75 in January 2016 to exit at $200,34.

Majority of the proceeds were converted to euro and deployed to grow our existing positions at Nasdaq Helsinki. The remaining dollars were used to open positions in Dell Technologies (NYSE: DELL) and CVS Health Corporation (NYSE: CVS).

Our position in Nokia Corporation (Nasdaq Helsinki: NOKIA) has been trimmed down significantly (over 50% sold). Our average entry cost - before trimming - was 3,13 euros with majority of the shares now sold having been acquired below that. Thus, a significant profit taken also from there. The proceeds were re-deployed to our other positions at Nasdaq Helsinki.

The main rationale behind the actions is to balance the portfolio and move money to the positions that seem to be much more promising over long term (5-10 year) than those that were sold.

We have now 25 stocks in portfolio and out of those 17 from Nasdaq Helsinki. Top 3 positions are dominated now by U.S names:

  1. Western Digital
  2. Apple
  3. Micron

Friday, July 26, 2019

Cost control

The expense ratio of an Exchange Traded Fund (ETF) measures how much of the assets are used for administrative and other operating expenses. Expense ratios have come down significantly over the years as the funds have grown and have thus become more efficient (same fees etc. divided by larger amount of assets under management).

ETF expense ratios vary typically between 0,1-0,8% and the lowest ratios are to be found among very popular passive index funds such as SPDR S&P 500 ETF Trust (NYSEARCA: SPY).

Compared to actively managed mutual funds ETFs have very low yearly fees. However, it's easy to fall into trap of thinking that expense ratios below 1% are small enough not to matter that much.

To illustrate why even expense ratios in the ballpark of 0,2-0,6% are significant over the very long term, I calculated two examples for investment of 10.000 euros over 40 years.


In the first scenario (above) I assumed that yearly gain is 5%. The difference between no yearly cost (expense ratio 0%) and 0,6% year cost is 14.422 EUR.

To get a more drama, I calculated a second scenario (below) where yearly gain is 10%. There the difference between no yearly cost (expense ratio 0%) and 0,6% year cost is staggering 88.935 EUR.


Naturally, the markets do not produce steady returns and there are ups and downs over the years. Thus, the calculations above are completely theoretical and made to illustrate the effect of yearly cost in simple scenarios.

Takeaway for buy and hold investors:

In the long run, it's not the profits alone that matter - also cost of holding matters a great deal!

The good news is that the investor can fully control his/her yearly fees by selecting ETFs smartly or investing directly into stocks.


Sunday, June 2, 2019

Winner take all - until..

Some of the Internet giants - also known as the "FAANG" companies based on their initials - start to be so big due to the winner-take-all effects that they may face antitrust lawsuit.

From what I understand two of the companies in particular are nearing this stage: Amazon and Google. Both are very dominant and vertically integrated (i.e. they develop most of their infrastructure by themselves). Apple is also vertically integrated, but in my view, they don't have the same kind of dominance in their respective markets than Google and Amazon do.

American Telephone & Telegraph Company (AT&T) is an interesting precedent because it was vertical integration - not it's domination in itself - that motivated Federal Communications Commission to sue AT&T. They suspected that the AT&T was using monopoly profits from its Western Electric subsidiary to subsidize the costs of its network, which was contrary to U.S. antitrust law. The case was filed by the United States Department of Justice in 1974. [source]


Vintage Telephone Equipment at Museum of Communications 
by Marcin Wichary [CC BY 2.0]

Initially, The plaintiff in the court complaint asked the court to order AT&T to divest ownership of Western Electric. AT&T didn't want to do this. Instead, they proposed to give up ownership of the local operating companies, which was what eventually took place in 1984. [source]

Over ten years later - in 1996 - AT&T divested also the equipment arm as Lucent. The end result is that no operator today has significant own development in the telecommunications equipment. There has been significant consolidation in both operator and equipment provider space (e.g. in latter space what used to be separate Alcatel, Lucent and Siemens Communications are now part of Nokia Corporation.

The same kind of development may have to take place in the Internet economy to prevent some corporations become too dominant for the market to function efficiently. Separating technology development from the "operator" function is one way. I'm not too deep into FAANG family so will not speculate on details. What is clear though is that monopoly (and near monopoly) is a bad thing in free market economy and authorities will step in when some company becomes too dominant. Winner really can't literally take all.


Disclosure: Long Nokia and Apple.

Monday, May 27, 2019

Thoughts on Technology stocks

Over third of our portfolio is invested into technology stocks. But what is considered a "Technology company" ?

It seems "Technology" in this context has come to mean computer, computer networking and electronics related technology and services:

  • Digital electronics (includes computers and components thereof)
  • Software
  • Services making use of computers and networking (e.g. on-demand video over Internet, e-commerce etc.)


Intel core i7-970 pin side
Image: Rainer Knäpper, Free Art License


"Tech" companies are often spending a lot on research and development (R&D) activity and many of them end up having sizable patent portfolio over time that protects their core innovations. 

I know R&D very well having spent more than 20 years in the front lines of technology development. It can be described as endless running competition. Even if you would have the advantage of being first in some space, you need to continue as others - perhaps companies 10 times your size - will be looking to enter the competition.

Netscape was first to release modern browser and it was at the time superior to anything before it. They were undisputed market leader in the mid 1990s with over 90% market share. Yet, by 2006 they had just 1% market share as Microsoft and many others invested heavily in their own browsers.

People typically see only the winners and forget the losers. For every "tech" that have made it big time there are tens of losers. And even those that make it "big" may not last for a very long time. This makes investing in "tech" very tricky. 

I have seen many first releases of a product and can say that in many that release will need considerable patching later on. Perhaps even second major release to really get it solid. The thing with R&D activity is that the more you have released the more you have to maintain. The maintenance part may - depending on the nature of the business - tie significant amount of R&D engineers. In the worst case, you need to also customize the releases for a given customer increasing the parallel software branches still.

Over time it is also easy to get locked in to a particular platform. Nokia's former mobile phone business is a famous example of this. They were so heavily locked to Symbian that they just could not pivot fast enough and were overrun by iOS from Apple and Android from Google. Apple didn't invent smart phone. They observed the market and available technology and eventually came up with far better design with iPhone that anyone before them - by a wide margin. They also came up with "Apps" and made the ecosystem fly.

Especially big tech companies have this kind of option that Microsoft used with browsers and Apple with smart phone. They can observe and learn from existing players while making their first release. If you are big (and skilled) enough, you can catch up pretty fast.

Therefore, small technology companies have to grow big fast or they risk being overrun. Many times the big will buy the promising small companies before they make it big. There are, of course, famous exceptions to this rule. The problem is that they are so visible and so good stories that people forget the "tech graveyard". The ones that didn't made it.

As an investor I tend to favor fairly valued established technology companies with long history, excellent brand and products, big enough footprint in their core markets, sizable patent portfolio and large R&D and sales departments. These are all things that are not easily replicated. For semiconductor stocks, you can add extremely expensive production lines requiring tens of years of know-how to build and operate.

It is hard to find "ten baggers" with this profile. However, it is possible to find companies that will see their market value grow many fold over time. That's good enough for me combined as it often comes with limited downside risk compared to whatever is currently "hot" in tech sector.

Sunday, May 19, 2019

A look at the co-investment arrangement for Nokia GLT

The group leadership team of Nokia Corporation (NYSE: NOK / Nasdaq Helsinki: NOKIA) owned about 4,8 million shares in Nokia at the end of 2018. They also have a very lucrative co-investment arrangement, which allows them to invest their own money in Nokia shares and receive two performance shares under the 2018 long-term incentive plan for every share they purchase. The plan vests on 1.1.2021.

I call this lucrative because purchasing and holding on to those shares will expose them to minimal risk of losses. Let's assume the plan vests at 100% i.e. they get two additional shares for every share they have purchased with their own money. That would mean they will make profit even if Nokia would trade at 2 euros (2+2*2 euros). For example, Rajeev Suri purchased the shares related to this plan with average price of 5,25 euros.

Therefore, I wanted to find out that how many shares out of the 2,4 million GLT members own fall into this category (of minimal risk).

Let's start from the CEO Rajeev Suri. He owns  2 473 450 shares out of which 575 309 shares via the co-investment plan. That's excellent news: Vast majority of his stake carries same risk than the rest of the shareholders in Nokia do. What's more: he purchased the maximum amount he was allowed to in the co-investment plan.

The rest of the GLT owned less than 2,4 million shares in the end of 2018 out of which a bit more than a million is explained by the co-investment arrangement. Maria Varsellona, President of Nokia Technologies and Chief Legal Officer, sold recently 128 000 shares so the ratio of "normal shares" to "shares under co-investment agreement" is about 1,3 to 1. Not bad, but not as good ratio as ratio that the CEO has: about 4,3 to 1.

All in all, I would say that the GLT, and especially the CEO, is well aligned with the interest of the rest of the stock holders and takes sufficiently risk also with their own money.


Disclosure: Long Nokia at the time of writing.

Wednesday, May 8, 2019

Sold Fortum

I have been trimming down our position in Fortum (Nasdaq Helsinki: FORTUM) during the last 12 months as in my view there has not been much upside potential left for quite some time now compared to the situation 2-3 years ago when the stock was trading at a lot lower level and offered nice asymmetric risk/reward potential then.

Today I decided to sell the position completely. The final trigger was news that the next Finnish cabinet will very likely be formed around the political left including the Greens of Finland and the Centre Party.

In my view this combination is the worst combination possible from the view point of Fortum, where Finnish state is majority owner with over 50% stake. To boot, the cabinet would be backed by the most anti-nuclear parties there is in Finland. While I do not think any of the parties will propose ramping down the existing plants, getting them replaced eventually would likely require another kind of cabinet setup.

In terms of plants in Fortum's portfolio, the likely political "hot potato" will be the vast number of coal plants owned by Uniper where Fortum now has a big stake. The bombardment to "shut down" has already started from the finnish environmental groups (even though the plants are not even in Finland!).

Overall the political ambition level towards changing the energy mix is a bit too high, which may manifest in hasty decisions which may have unwanted consequences in the energy market.

However, Most of all it's just the socialist agenda that is in my opinion the big problem. The cabinet will not be shareholder friendly (of any company - listed or not). On top of that, there is a history of cabinet officials meddling with Fortum at least indirectly (via meddling with the board and other governance structures).

My all time favourite meddling was related to Fortum options. The politicians failed to oppose very lucrative option deal at the time when it caused the dilutation (when options were issued) to share holders. It was only when the the options were sold at huge profits that the scheme became a massive political problem.

The funny thing is that once dilutation had taken place, it was actually good for the state that the options had value. Most of the money from the options came back to government because of the ~60% tax rate for very high income individuals.