Saturday, January 4, 2020

2019 - Best year ever

Happy New Year 2020!

The year 2019 ended up to be the best year we have ever had in stock markets in terms of

  • yearly gains (+36,2%)
  • gains relative to our benchmark investment* - passive index investing (+8,6%)
  • absolute gains 💰


Our best performing stocks were mainly from USA: Apple and most of our semiconductor plays (NVIDIA, Micron and Western Digital). Also some of our Finnish stocks did really well even though the Finnish market lagged most other markets with OMXH25 index returning "just" about 15%.


Portfolio performance 2009-2019.

Note: "Difference" column uses exact values as input rather than figures rounded to 1 decimal that are displayed.

In terms of cumulative yearly gains, we are now 17,7% above the benchmark investment. In the larger scheme of things (cumulative gains net of taxes 218,8% so far) this is very small deviation. Therefore, the key contributor to gains have been quite simply the decision to stay fully invested in the market.
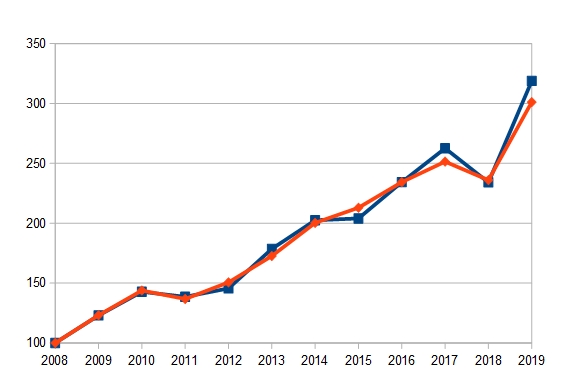

Cumulative gains of our portfolio (blue line) vs. benchmark investment (red line). 31.12.2008 = 100.


As a new chart I have included the view to the absolute value of the portfolio so that the starting level on 31.12.2018 is scaled to 100. The orange bars single out money added to the portfolio each year. I would call this "the snowball view" as it gives very good idea on the benefits of compounding gains. 

It also puts in perspective our worst year (2018) and our best year (2019) so far. 

Portfolio absolute size (scaled 2008 = 100)

What we started with at end of 2008 (scaled to 100) has grown to 25-fold portfolio over the past 11 years.

Going into 2020 we continue to be almost 100% invested into stocks. I will cover our starting allocation in the next post.


*) The "benchmark investment" is an imaginary passive ETF that closely tracks the performance of MSCI all country world (ACWI) index in euros (more info here). 

Tuesday, October 29, 2019

Increased Nokia position

I have been trimming down our Nokia position during this year and after Q1 result wrote that
"the stock hasn't gone anywhere in last 5 years."

Well,
Now it has, but not to the direction investors would like to see:


Nokia Corporation share price in New York (USD) last 5 years.
Chart courtesy of StockCharts.com


Stock price is now below 5 year lows (in dollars) and to me it looked like a good opportunity to once again increase the position.

After Q1 I wrote:
"My key worry relates to very weak gross margin (GM) in the core business outside of patent/licensing business."

Networks unit GM was better than Q1, but still weak below 30% (and 5% lower than a year before).

Nokia Software GM improved 5% year on year and operating margin more than doubled so that's in a good track.

Nokia Technologies delivers - as always - stellar GM (97,8%) and OP (82,1%).

So, despite the very negative reaction in stock market, it's fair to say the business - especially Nokia Software unit - is going to the right direction.

I think the stock price movement was mostly due to Nokia lowering the expectation for the years 2019-2020 and beyond. Also, halting of quarterly paid dividend - even if just for Q3 and Q4 as announced - is an alarming signal.

All in all, Nokia management moved the ball one year forward stating "We expect that we will be able to progressively mitigate these issues over the course of next year.".

2020 was supposed to be a really good year, but now the payday has been moved forward and it doesn't look so sweet as it used to.

Nevertheless, the potential is there. It is not all bad.

The company just needs to get all the ducks properly in the row - especially in the Mobile Networks side of the house, which is the key to success in 5G.

Once again, I bet our money on Nokia board of directors and management making the right calls. The investors are now in need of clear positive signals.

At these levels there is already some safety of margin given e.g. some sum-of-parts analysis that I have seen (everyone can make their own estimate on the value of e.g. patent portfolio, Nokia Software and so forth). However, I would not be surprised if the fall in stock price would continue still.


Disclosure: We are long Nokia and do not consider to sell or buy in next 48 hours.

Monday, August 12, 2019

Portfolio update

We continue almost fully invested in stocks (~99%).

Our new sector allocation for stocks look like this (please click the picture to enlarge):


The main theme is "technology and related services" as nearly 50% of the portfolio is now allocated to companies providing high tech products and/or services (software and/or hardware) or supplying components to such companies (e.g. semiconductor manufacturers).

In terms of place of incorporation, more than 60% are based our home country (Finland, Europe) and the rest are based in USA. Majority of the corporations operate and sell globally.


Friday, August 9, 2019

Sold Berkshire Hathaway and trimmed down Nokia

I have made many changes in our portfolio.

Selling all shares in Berkshire Hathaway (NYSE: BRK.B) is the most significant move this year. The position grew to be our largest position from entry at $126,75 in January 2016 to exit at $200,34.

Majority of the proceeds were converted to euro and deployed to grow our existing positions at Nasdaq Helsinki. The remaining dollars were used to open positions in Dell Technologies (NYSE: DELL) and CVS Health Corporation (NYSE: CVS).

Our position in Nokia Corporation (Nasdaq Helsinki: NOKIA) has been trimmed down significantly (over 50% sold). Our average entry cost - before trimming - was 3,13 euros with majority of the shares now sold having been acquired below that. Thus, a significant profit taken also from there. The proceeds were re-deployed to our other positions at Nasdaq Helsinki.

The main rationale behind the actions is to balance the portfolio and move money to the positions that seem to be much more promising over long term (5-10 year) than those that were sold.

We have now 25 stocks in portfolio and out of those 17 from Nasdaq Helsinki. Top 3 positions are dominated now by U.S names:

  1. Western Digital
  2. Apple
  3. Micron

Friday, July 26, 2019

Cost control

The expense ratio of an Exchange Traded Fund (ETF) measures how much of the assets are used for administrative and other operating expenses. Expense ratios have come down significantly over the years as the funds have grown and have thus become more efficient (same fees etc. divided by larger amount of assets under management).

ETF expense ratios vary typically between 0,1-0,8% and the lowest ratios are to be found among very popular passive index funds such as SPDR S&P 500 ETF Trust (NYSEARCA: SPY).

Compared to actively managed mutual funds ETFs have very low yearly fees. However, it's easy to fall into trap of thinking that expense ratios below 1% are small enough not to matter that much.

To illustrate why even expense ratios in the ballpark of 0,2-0,6% are significant over the very long term, I calculated two examples for investment of 10.000 euros over 40 years.


In the first scenario (above) I assumed that yearly gain is 5%. The difference between no yearly cost (expense ratio 0%) and 0,6% year cost is 14.422 EUR.

To get a more drama, I calculated a second scenario (below) where yearly gain is 10%. There the difference between no yearly cost (expense ratio 0%) and 0,6% year cost is staggering 88.935 EUR.


Naturally, the markets do not produce steady returns and there are ups and downs over the years. Thus, the calculations above are completely theoretical and made to illustrate the effect of yearly cost in simple scenarios.

Takeaway for buy and hold investors:

In the long run, it's not the profits alone that matter - also cost of holding matters a great deal!

The good news is that the investor can fully control his/her yearly fees by selecting ETFs smartly or investing directly into stocks.