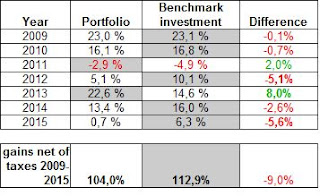
It's time to compare the performance of our portfolio in the year 2015 against passive index investing.
Our "benchmark investment" is an imaginary passive ETF that closely
tracks the performance of MSCI all country world (ACWI) index in euros.
This time I knew even before calculations that we would loose to the index.
The only question was how much.
Our performance during 2009-2015 has been as follows:
Euro continued it's decline in 2015 from 1,2096 USD to 1,0858 USD (-10,23%). A bit smaller decline than 2014, but sizable nevertheless. Our portfolio is much more tilted to Europe and Eurozone than the ACWI index where U.S dollar exposure is currently 53% (source: XTF). This was one clear reason for loosing to the benchmark. However, clearly biggest reason is poor performance of many of our positions. Year 2015 continued to be bad for oil and mining sectors overall.
Cumulative gains of our portfolio (blue line) vs. benchmark investment (red line). 31.12.2008 = 100.
The difference to benchmark can be put better to perspective in a chart. It's actually amazing how closely we overall track the benchmark given that our portfolio has very different region & sector allocations compared to ACWI index.
Continuing with positive note, readers familiar with passive index investing know that most professional (very well paid!!) money managers and actively managed funds loose to their benchmark index over time. A recent CNCB article regarding active vs. passive investing gave interesting data points to think about:
"Morningstar data show that this year, through Oct. 31, roughly 58.6 percent of actively managed funds have failed to beat their benchmarks. And over the last 10 years, 73 percent of actively managed funds have fallen short."While I use many passively managed ETFs, most of our positions are in individual companies. This combined with rather small yearly changes to the portfolio makes our portfolio kind of "passive-active" blend.
It would be plain dull to have fully passive portfolio (even though so far we would have been better served with that kind).
Our benchmark index 2009-2015 (based on data from MSCI All Country World Index; Net; Euros)
If you want to know more about our "bechmark investment" and the way above comparisons are calculated, please read the latter part of portfolio performance update from 2014.


No comments:
Post a Comment