I have now 21 companies in our portfolio. The distribution of funds is as follows:
Sector: Portion of funds: (Target)
Cash 2.5 % (0%)
Gold 13.1 % (10%)
Green Energy Technology & Generation 15.8 % (15%)
Health Care 15.7 % (15%)
Information Technology 10.8 % (15%)
Mining & Exploration 11.5 % (15%)
Oil & Gas Production 12.8 % (15%)
Telecommunications 17.7 % (15%)
Chinese companies China Mobile and BYD have been going down since the purchases. Also Cisco is down 10%. Despite of this, I continue to believe in these companies. In general, I am waiting for the dividends to roll in.
Sunday, February 13, 2011


Saturday, February 12, 2011
First Year of Blogging
Exactly one year ago I published my first article titled "Gold Fever!" in this blog. It took me a while to decide whether I use english or finnish, but I selected english because I believed that what I say interests probably more outside Finland than inside. Looking back using Google Analytics as tool - I was right. So far there has been 5,867 page views from 2,881 unique visitors from 95 countries. Thanks for interest! This is certainly much more than I ever expected to have after first year!!
Top 5 traffic sources (countries)
1. Finland
2. United States
3. Canada
4. United Kingdom
5. Australia
Top 5 traffic sources (sites/referral)
1. Direct
2. Google
3. AP Areena / Arvopaperi.fi
4. Seeking Alpha
5. My finnish blog
Top 10 articles (pageviews)
1. Nautilus Minerals
2. Fred Olsen Energy
3. An Indepth Look on Sanofi-Aventis*
4. The Myth Of Moore's Law
5. Soros and Gold
6. Is Western Digital a Bargain*
7. The End of The Golden Age*
8. Financial Crisis 2.0
9. Critical Materials for Clean Energy Technology
10. BYD - Build Your Dreams*
The articles marked with asterix (*) have been also published as articles in Seeking Alpha. Seeking Alpha focuses on U.S. stock market so the qualifying articles have to touch subjects that interests their readers. I typically submit such articles atleast to my "instablog" at Seeking Alpha.
The pageviews for my articles at Seeking Alpha have ranged from 3,640 to 54,389 per article (typically some thousands rather than >10,000). Encouraging numbers - so I will keep on writing.
Top 5 traffic sources (countries)
1. Finland
2. United States
3. Canada
4. United Kingdom
5. Australia
Top 5 traffic sources (sites/referral)
1. Direct
2. Google
3. AP Areena / Arvopaperi.fi
4. Seeking Alpha
5. My finnish blog
Top 10 articles (pageviews)
1. Nautilus Minerals
2. Fred Olsen Energy
3. An Indepth Look on Sanofi-Aventis*
4. The Myth Of Moore's Law
5. Soros and Gold
6. Is Western Digital a Bargain*
7. The End of The Golden Age*
8. Financial Crisis 2.0
9. Critical Materials for Clean Energy Technology
10. BYD - Build Your Dreams*
The articles marked with asterix (*) have been also published as articles in Seeking Alpha. Seeking Alpha focuses on U.S. stock market so the qualifying articles have to touch subjects that interests their readers. I typically submit such articles atleast to my "instablog" at Seeking Alpha.
The pageviews for my articles at Seeking Alpha have ranged from 3,640 to 54,389 per article (typically some thousands rather than >10,000). Encouraging numbers - so I will keep on writing.
Friday, February 11, 2011
Nokia and Microsoft
I added both to our portfolio. I have been Nokia holder many times during last 15 years and have considered lately to buy in again. Well, today came the perfect opportuníty. I am glad I didn't buy before the big announcement, because now I got them below 7 euros. And that I consider to be some seriously cheap Nokia stock. For one thing, I do not think market really values Nokia Siemens Networks (a joint 50/50 venture owned by Siemens and Nokia) and Navteq at all. Not that they contribute much to the overall result. Nevertheless, as separate companies each would be worth billions. Therefore, I believe there exists a healthy margin of safety in the current valuation of Nokia (forward P/E 11.96, P/FCF 11.77, P/B 2.08). In addition, the dividend yield is now in the range of 5%.
Microsoft, on the other hand, stands to gain handsomely from the Nokia's announcement to focus on Windows Mobile. Markets obviously don't think so as Microsoft was trading downwards both today and yesterday when Nokia-Microsoft deal was already looking quite obvious given all news, leaks and speculation on the subject.
Microsoft, like I have written before, is one of those companies that have moat. Economic moat is a competitive advantage that is difficult to copy or emulate and which provides a significant barrier to competition from other firms. Warren Buffett has often referred to an economic moat as being similar to a fortress or a medieval castle that one can not penetrate. Microsoft is as close to monopoly (in PC/laptop operating system market) as a company can get.
Like Nokia, Microsoft is also attractively valued. Forward P/E 10, P/FCF 12.55 and P/B 4.77. Microsoft dividend is 2.3%. Both Nokia and Microsoft have a big pile of CASH making the valuations even more attractive.
Source for all stock data / valuations: Finwiz.com.
Microsoft, on the other hand, stands to gain handsomely from the Nokia's announcement to focus on Windows Mobile. Markets obviously don't think so as Microsoft was trading downwards both today and yesterday when Nokia-Microsoft deal was already looking quite obvious given all news, leaks and speculation on the subject.
Microsoft, like I have written before, is one of those companies that have moat. Economic moat is a competitive advantage that is difficult to copy or emulate and which provides a significant barrier to competition from other firms. Warren Buffett has often referred to an economic moat as being similar to a fortress or a medieval castle that one can not penetrate. Microsoft is as close to monopoly (in PC/laptop operating system market) as a company can get.
Like Nokia, Microsoft is also attractively valued. Forward P/E 10, P/FCF 12.55 and P/B 4.77. Microsoft dividend is 2.3%. Both Nokia and Microsoft have a big pile of CASH making the valuations even more attractive.
Source for all stock data / valuations: Finwiz.com.
Thursday, February 3, 2011
Critical Materials For Clean Energy Economy
Rare Earth Elements
Rare earth elements have geochemical properties that make them typically dispersed and not often found in concentrated and economically exploitable forms [Wikipedia]. These metals are used in many hi-tech devices. In particular, rare earth elements are used in clean energy applications such as wind turbines, electric vehicles, photovoltaic cells and energy-efficient fluorescent lighting. Clean energy technologies currently constitute only about 20 percent of global consumption of critical materials. However, their share of total consumption is expected to grow as the use of these clean energy technologies is expected to grow rapidly.

Export restrictions placed by China for rare earth metals have raised conserns of supply disruptions. However, the Critical Materials Strategy published by U.S Department of Energy in December 2010 points out that only a handful of rare earth elements are actually at risk of supply disruptions in medium term (5-15 years).

The table 1 summarizes the key data in the DOE report in my opinion. The materials that are either listed as critical (red) or near critical (yellow) are bolded. The ”criticality”-factor in the table is a sum of “supply risk” (1 = low; 4 = high) and “importance to clean energy” (1 = low; 4 = high) as determined by DOE in their report (see pictures below from the report for reference). Higher number indicates higher risks.


If you want to know more about these critical materials I suggest that you check this rare earth primer, this excellent article about lithium and information about the periodic table.
Only five metals continue to be critical in terms of supply risk in medium term (5-15 years).
• Dysprosium (Heavy REE) is used in permanent magnets for wind turbines and vehicles with electric drive trains.
• Neodymium (Light REE) is used in batteries for vehicles with electric drive trains and in permanent magnets for wind turbines and vehicles with electric drive trains.
• Terbium (Heavy REE), Yttrium (Heavy REE) and Europium (Medium REE) are used in fluorescent lighting phosphors.
Most rare earth mines in operation provide lots of Lanthanum and Cerium as will do those mines that are the most likely to come online in the next 5 years. Therefore, Lanthanum and Cerium supply situation looks rather good compared to many other strategic materials.

Table 2. Projects that have possibility to come online in the next 5 years (Data source: Critical Materials Strategy published by U.S Department of Energy in December 2010)
The most attractive rare earth elements are naturally the ones with the highest risk of supply disruptions in medium term (5-15 years): Neodymium, Europium, Terbium, Dysprosium and Yttrium. These metals are highlighted as red in the table above. In terms of critical REO content out of total REO, the projects can be ranked as follows:
1. Alkane Resources: Dubbo Zirconia project (32,3%)
2. Avalon Rare Metals (AVARF.PK): Nechalacho project (29%)
3. Great Western Minerals (GWMGF.PK): Hoidas Lake project (24,3%)
4. Arafura Resources (ARAFF.PK): Nolans Bore project (22,3%)
5. Lynas Corporation (LYSCF.PK): Mount Weld project (15,7%)
6. Molycorp (MCP): Mountain Pass project (12,2%)
7. Vinacomin/Sojitz/Toyota-Tsusho: Dong Pao project (10,7%)
I happened to notice that Lynas Corporation has reported a bit different distribution of REO materials in their investor presentation from March 2010. Based on that report, the percentage of critical REO out of total REO is 19,1%. Nevertheless, I decided to go with DOE figures to be consistent as it was not possible for me to get data from all these corporations regarding exact REO content. Before investing in any of these companies, I suggest a thorough review of their resources and other projects as well as funding.
Lithium and two other metals determined as “near critical” to clean tech by DOE
Three metals are determined to be “near critical” in medium term (5-15 years).
• Lithium is used in batteries for vehicles with electric drive trains.
• Indium and Tellurium are used in photovoltaic thin films for solar cells.
Regarding Lithium the U.S. DOE reports: “Lithium is the only key material that shifts into a higher criticality category from the short to medium term. This change is due to the rapid increases in market penetration projected for vehicles using lithium-ion batteries, which increases lithium’s importance to clean energy. This market penetration would significantly increase demand even as lithium production capacity increases, thus increasing supply risk slightly.”
Rare earth elements have geochemical properties that make them typically dispersed and not often found in concentrated and economically exploitable forms [Wikipedia]. These metals are used in many hi-tech devices. In particular, rare earth elements are used in clean energy applications such as wind turbines, electric vehicles, photovoltaic cells and energy-efficient fluorescent lighting. Clean energy technologies currently constitute only about 20 percent of global consumption of critical materials. However, their share of total consumption is expected to grow as the use of these clean energy technologies is expected to grow rapidly.

Source: Critical Materials Strategy, U.S DOE, 2010.
Export restrictions placed by China for rare earth metals have raised conserns of supply disruptions. However, the Critical Materials Strategy published by U.S Department of Energy in December 2010 points out that only a handful of rare earth elements are actually at risk of supply disruptions in medium term (5-15 years).

Table 1. Critical materials for clean energy technologies (Data source: Critical Materials Strategy published by U.S Department of Energy in December 2010)
The table 1 summarizes the key data in the DOE report in my opinion. The materials that are either listed as critical (red) or near critical (yellow) are bolded. The ”criticality”-factor in the table is a sum of “supply risk” (1 = low; 4 = high) and “importance to clean energy” (1 = low; 4 = high) as determined by DOE in their report (see pictures below from the report for reference). Higher number indicates higher risks.

Short term Criticality Matric. Source: Critical Materials Strategy, U.S DOE, 2010.

Medium term Criticality Matric. Source: Critical Materials Strategy, U.S DOE, 2010.
If you want to know more about these critical materials I suggest that you check this rare earth primer, this excellent article about lithium and information about the periodic table.
Only five metals continue to be critical in terms of supply risk in medium term (5-15 years).
• Dysprosium (Heavy REE) is used in permanent magnets for wind turbines and vehicles with electric drive trains.
• Neodymium (Light REE) is used in batteries for vehicles with electric drive trains and in permanent magnets for wind turbines and vehicles with electric drive trains.
• Terbium (Heavy REE), Yttrium (Heavy REE) and Europium (Medium REE) are used in fluorescent lighting phosphors.
Most rare earth mines in operation provide lots of Lanthanum and Cerium as will do those mines that are the most likely to come online in the next 5 years. Therefore, Lanthanum and Cerium supply situation looks rather good compared to many other strategic materials.
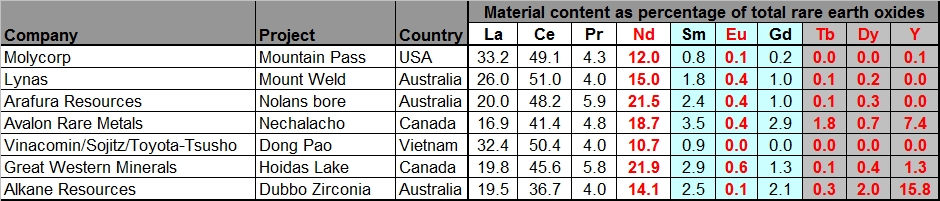
Table 2. Projects that have possibility to come online in the next 5 years (Data source: Critical Materials Strategy published by U.S Department of Energy in December 2010)
The most attractive rare earth elements are naturally the ones with the highest risk of supply disruptions in medium term (5-15 years): Neodymium, Europium, Terbium, Dysprosium and Yttrium. These metals are highlighted as red in the table above. In terms of critical REO content out of total REO, the projects can be ranked as follows:
1. Alkane Resources: Dubbo Zirconia project (32,3%)
2. Avalon Rare Metals (AVARF.PK): Nechalacho project (29%)
3. Great Western Minerals (GWMGF.PK): Hoidas Lake project (24,3%)
4. Arafura Resources (ARAFF.PK): Nolans Bore project (22,3%)
5. Lynas Corporation (LYSCF.PK): Mount Weld project (15,7%)
6. Molycorp (MCP): Mountain Pass project (12,2%)
7. Vinacomin/Sojitz/Toyota-Tsusho: Dong Pao project (10,7%)
I happened to notice that Lynas Corporation has reported a bit different distribution of REO materials in their investor presentation from March 2010. Based on that report, the percentage of critical REO out of total REO is 19,1%. Nevertheless, I decided to go with DOE figures to be consistent as it was not possible for me to get data from all these corporations regarding exact REO content. Before investing in any of these companies, I suggest a thorough review of their resources and other projects as well as funding.
Lithium and two other metals determined as “near critical” to clean tech by DOE
Three metals are determined to be “near critical” in medium term (5-15 years).
• Lithium is used in batteries for vehicles with electric drive trains.
• Indium and Tellurium are used in photovoltaic thin films for solar cells.
Regarding Lithium the U.S. DOE reports: “Lithium is the only key material that shifts into a higher criticality category from the short to medium term. This change is due to the rapid increases in market penetration projected for vehicles using lithium-ion batteries, which increases lithium’s importance to clean energy. This market penetration would significantly increase demand even as lithium production capacity increases, thus increasing supply risk slightly.”
Lithium is best played in my opinion with Global X Lithium ETF (LIT) that includes lithium miners and battery manufacturers. The valuations of most companies included in the ETF are quite reasonable when compared to rare earth companies that are not even producing anything yet.
Full disclosure: Long LIT.
Friday, January 14, 2011
Top 10 most owned stocks by super investors
Dataroma.com tracks investment activities of successful value oriented “super investors” such as Warren Buffett and Bruce Berkowitz. This article examines the top 10 most owned stocks by the 48 investors tracked by Dataroma. Microsoft (MSFT) is the most owned stock currently (21 out of 48 investors holding it). Dell is the 10th most owned stock (12 out of 48 investors holding it). As you can see from the table below, the Top 10 has changed a lot in 4 years. Only three stocks remain the same: Johnson & Johnson (JNJ), Wal-Mart Stores (WMT) and Dell Inc (DELL).

A closer look at history revealed that only Johnson & Johnson and Wal-Mart have stayed in Top 10 in all quarters for the past 4 years. Between Q1 2007 and Q2 2008 Dell dropped out of Top 10. By plotting the rankings of these three companies quarter by quarter it becomes clear which stock has been the true favourite of these super investors between 2007 and present: Johnson & Johnson (JNJ).

Note: 11th place means “out of top 10” (i.e ranking lower than 10).
It is also interesting to see that now half of the Top 10 consists of financial or insurance companies. Back in 2007 there were only two: AIG and Citigroup. Neither of those companies are in Top 10 anymore.
Full disclosure: Long JNJ.

A closer look at history revealed that only Johnson & Johnson and Wal-Mart have stayed in Top 10 in all quarters for the past 4 years. Between Q1 2007 and Q2 2008 Dell dropped out of Top 10. By plotting the rankings of these three companies quarter by quarter it becomes clear which stock has been the true favourite of these super investors between 2007 and present: Johnson & Johnson (JNJ).

Note: 11th place means “out of top 10” (i.e ranking lower than 10).
It is also interesting to see that now half of the Top 10 consists of financial or insurance companies. Back in 2007 there were only two: AIG and Citigroup. Neither of those companies are in Top 10 anymore.
Full disclosure: Long JNJ.
Subscribe to:
Posts (Atom)