Friday, December 9, 2016

Avoid costs

Actively managed stock funds charge yearly fees of 1-3%. Some take management fees even north of 4%. Yet, most of them fail to beat their benchmark index.

It's easy to think yearly cost of 1-2% does not matter much.
Big mistake.

The difference between paying 2% of yearly management fees vs. none is 189.000 in lost capital gains over 30 years for 100.000 initial investment with annual 5% gain. See below.


The difference gets even more staggering if just one parameter is changed. With annual gain of 10% you would miss gains of 739.000.


In long run, it's not the profits alone that matter - also cost of holding matters a great deal!


Tuesday, November 29, 2016

Exit from Telia

Decided to exit from Telia, which was our last position in the Communication Service Provider -segment. I do not see that segment nor companies in it as attractive from investment perspective as our other focus segments:

  • Information Technology
  • Health Care
  • Renewable energy
  • Low-Emission Power Generation
  • Forest Industry
  • Metal Industry
  • Oil & Gas Production
  • Mining & Exploration

Information technology is heavily overweight in our portfolio currently compared to rest of the segments.


Sunday, October 30, 2016

Helsinki Top 20

I use a service provided by Valuatum.com via Pörssisäätiö to screen stocks listed in NASDAQ OMX Helsinki. I use the screen periodically to check where our holdings stand relative to other companies listed in Helsinki. Naturally I am also continuously screening for new investment ideas.

The results of my personalized screen are disclosed below.

The Top 20 list continues to contain many small companies. Many of them are in investment/banking business (e.g. all in Top 6 are such).

Our positions are marked with prefix ">".

Rank Company (Score)
----------------------------------------
#1 Privanet (3,5)
#2 Investors House (3,0)
#3 eQ (3,0)
#4 Orava Asuntorahasto (3,0)
#5 CapMan (2,8)
#6 Suomen Hoivatilat (2,8)
#7 Incap (2,7)
#8 Technopolis (2,5)
>#9 Citycon (2,5)
#10 Detection Technology (2,3)
#11 Revenio Group (2,3)
#12 Raute (2,2)
#13 United Bankers (2,0)
#14 Sponda (2,0)
#15 Orion (2,0)
#16 Sampo (2,0)
#17 Taaleri (2,0)
#18 Nokian Renkaat (2,0)
#19 Okmetic (1,9)
#20 Ponsse (1,9)

...

>#24 Siili Solutions (1,8)
>#39 Telia (1,5)
>#46 UPM (1,4)
>#58 Fortum (1,3)
>#82 Nokia (0,9)
>#89 Metso (0,8)

Out of my positions Fortum, UPM, Nokia and Metso have gone down in both score and rank significantly since last time I checked (April 30th, 2016). Still, overall the positions seem to be above average rank and score wise.

Except for Nokia, Citycon and Telia my positions are higher than they were in April 30th. UPM is significantly up from where it were. This partially explains the changes. However, I fear also the forward projections have been melting down for some of these companies.

Average Score of all companies in the research database: 1,3
Average Score of our positions: 1,5

Median Score 1,2
Our positions that have higher score than median: 5 out of 7

Worst Score 0,1 (#119 Nextim)


Parameters used in screen (weight):
-------------------------------------------
 P/B estimate current year (13%)
 P/E estimate current year; next year (8%; 10%)
 Dividend yield estimate current year; next year (8%, 8%)
 ROA estimate current year (10%)
 ROI estimated 3 year average ending current year (8%)
 ROE estimated 3 year average ending next year (8%)
 Turnover estimated increase in 3 years ending next year (8%)
 Net Profit estimated increase in 3 years ending next year (8%)
 Gross Margin estimate current year (8%)
 Profit Margin estimate current year (8%)


The used parameters emphasize attractive valuation (31%), profitability in broad sense (26% weight), growth (16%) and dividend yield (16%).


The screen relies on estimates about future. Those combined with volatility of stock prices means that you should not try to chase screens like these (I don't). Ultimately any investment decision should be based on much more than just looking at the current numbers and estimates of future numbers.

Monday, September 19, 2016

Which stocks famous money managers hold?

Dataroma tracks famous value oriented money managers that they call "superinvestors". Among them are legendary investors like Warren Buffett.

I regularly take a look what they hold, what they have bought and what let go.

Here is "Top 20" by ownership count compared to situation I had on file from June 2015 (please click to enlarge):


I included all stocks that had up to 10 owners among the famous investors tracked by Dataroma.

Previously I had 22 most owned stocks on file. Two additional were selected as Google and Berkshire appear in top 20 twice with different classes of shares. Last time I didn't check whether there were more stocks with 9 owners than the ones I took from the list in the order they appeared. Therefore, new entries in this September 2016 list have June 2015 ownership count filed as "9 or below".

There are few notable changes:
  • American Express ownership count has risen by 6. 
  • U.S. Bancorp is new in the list and made it quite high (change +4 or more)
  • Other new in the list are United Health Group Inc., Wal-Mart Stores and Visa Inc.
Finally, listed those that no longer made to the "top 20" list. None had any major difference to June 2015 as can be seen in the table.

All in all, not too much change in the list, which isn't maybe surprising considering all tracked inverstors being labeled as "value investors".

Sunday, September 11, 2016

Portfolio change: Leading Edge Materials Corp

Just a small update on portfolio this time.

Our tiny position in Tasman Metals has now turned into tiny position in the Leading Edge Materials Corporation (TSX.v:LEM). The company was formed via merger of Tasman Metals Ltd. and Flinders Resources Limited.

The new company has two flagship projects in Sweden:
  • Woxna (Graphite)
  • Norra Kärr (Rare Earth Elements - REE)
Woxna is "production ready". Production has been halted due to low market price for graphite.

Tasman continues to own 100% of the Norra Karr project under exploration license while the mining lease application documentation is being reassessed.
 
From investment perspective the risk profile of the company didn't greatly improve via the merger from what is was before as exploration stage company.

Company continues to be a very high risk investment.

Saturday, July 23, 2016

Titanic and Fred Olsen Energy

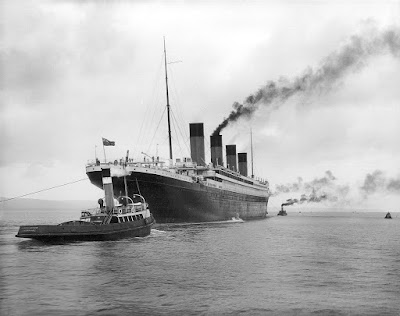
RMS Titanic needs no introduction.

RMS Titanic leaving Belfast for her sea trials on 2 April 1912
Picture by Robert John Welch (via Wikipedia).
However, the linkage to Fred Olsen Energy likely does.

RMS Titanic was the second of three Olympic class ocean liners built by the Harland and Wolff shipyard in Belfast. Today majority owner of that company is Fred Olsen Energy ASA, headquartered in Oslo, Norway.

From the investment perspective this piece of information isn't really meaninful because close to 99% of the revenue for Fred Olsen Energy comes from Dolphin Drilling. In case you haven't followed, offshore drilling companies haven't been doing well for some time due to sinking oil price and subsequently decreasing oil exploration activity. The market for equipment and services provided by Doplhin Drilling are currently in oversupply.

Therefore, values of offshore drilling companies - like Fred Olsen Energy - have plummetted.

Fred Olsen Energy closed on Friday 22nd July 2016 at 16,10 NOK. There are 66,69 million shares so the market valuation for the company is 1073,7 million NOK which is roughly 125,5 million USD.

Compare this with the book value of just one of it's assets - the Bolette Dolhin - a drill ship built in 2014. It was valued at 584 million USD with estimated 23 years of lifetime left in end of 2015.

The most valuable assets of the company are the two drill ships (Bolette and Belford) and four rigs (Blackford, Borgland, Bideford and Byford). Rest of the fleet is valued clearly lower in the books. 

The problem with all the assets naturally is that if nobody needs those ships and rigs they are essentially rendered worthless. Like Titanic after it hit the iceberg and sank.

In Q2 report the company estimated contract backlog for it's ships and rigs being 650 million USD. Most of the current contracts will end between September 2016 and March 2017. After that only two contracts continue: Bollette and Borgsten.

This means that any changes in contract status will have huge effect on the valuation of the company. There is also an outstanding legal dispute about Bollsta Doplhin (new build which was cancelled) where claims are larger than the current valuation of the company on both sides.

Eventually, the key for survival from my perspective seems to be how they are able to manage the debt load (net debt at end of Q2 2016 ~969 million USD) to a level they can carry with the remaining contracts until the market stabilizes. Currently they are getting still good cash flow from operations but it's trending lower (Q1 2016: 115,6 million USD ; Q2 2016: 90,2 million USD).

Certainly very risky investment (turnaround bet) at this time. Nevertheless, I am willing to take the risk and assume there will be a turnaround in time (to me it seems they need new contracts before end of 2017).

By the way, Friday 22nd of July also CFO of Fred. Olsen Energy ASA (Hjalmar Krogseth Moe) seems to have initiated position of 10,000 shares at a price of NOK 16.40 per share.

Saturday, April 30, 2016

Helsinki Top 20

I use a service provided by Valuatum.com via Pörssisäätiö to screen stocks listed in NASDAQ OMX Helsinki. I use the screen periodically to check where our holdings stand relative to other companies listed in Helsinki. Naturally I am also continuously screening for new investment ideas.

The results of my personalized screen are disclosed below. I use different criteria and weights than the default "Liisa's list" that is featured in the pages of Pörssisäätiö. Often I check both lists to get two different angles.

This time the Top 20 list contains many small companies in Top 10. Many of them are in investment/banking business.


Our positions are marked with prefix ">".

Rank Company (Score)
----------------------------------------
#1 United Bankers (3,3)
#2 Investors House (3,0)
#3 eQ (2,9)
#4 Orava Asuntorahasto (2,9)
#5 CapMan (2,8)
#6 Suomen Hoivatilat (2,8)
>#7 Citycon (2,5)
#8 Technopolis (2,4)
#9 Raute (2,4)
#10 Revenio Group (2,3)
#11 Taaleri (2,3)
#12 Sponda (2,2)
#13 Sampo (2,1)
#14 Restamax (2,1)
>#15 Siili Solutions (2,1)
#16 SRV Yhtiot (2,1)
#17 Martela (2,1)
#18 Orion (2,0)
#19 Ramirent (2,0)
#20 Okmetic (2,0)

...

>#31 Fortum (1,7)
>#35 Telia (1,6)
>#37 UPM (1,6)
>#51 Nokia (1,5)
>#72 Metso (1,2)

...

Average Score of all companies in the research database: 1,4
Average Score of our positions: 1,7

Median Score 1,4
Our positions that have higher score than median: 6 out of 7

Worst Score 0,1 (#110 Basware)


Parameters used in screen (weight):
-------------------------------------------
 P/B estimate current year (13%)
 P/E estimate current year; next year (8%; 10%)
 Dividend yield estimate current year; next year (8%, 8%)
 ROA estimate current year (10%)
 ROI estimated 3 year average ending current year (8%)
 ROE estimated 3 year average ending next year (8%)
 Turnover estimated increase in 3 years ending next year (8%)
 Net Profit estimated increase in 3 years ending next year (8%)
 Gross Margin estimate current year (8%)
 Profit Margin estimate current year (8%)

The used parameters emphasize attractive valuation (31%), profitability in broad sense (26% weight), growth (16%) and dividend yield (16%).

The screen relies on estimates about future. Those combined with volatility of stock prices means that you should not try to chase screens like these (I don't). Ultimately any investment decision should be based on much more than just looking at the current numbers and estimates of future numbers.

Sunday, March 13, 2016

Risky, Riskier, Exploration stage mining company

A reader asked about my opinion on latest developments in Nautilus Minerals (TSX: NUS). Let me comment more broadly this types of very risky investments. For that I want to bring in Tasman Metals (TSX.V: TSM) and Talvivaara also in the discussion.

Talvivaara is a Finnish mining company that used to be listed in both London and Helsinki stock exchanges. I have been following developments of these three mining companies for many years.

Let's start with Talvivaara for three important learnings:

1) Never ever look into past valuation or past stock price (consider those meaningless no matter how compelling story there is about what treasures lie in underground/water). Many investors kept pouring money into Talvivaara as the stock plummeted probably thinking they are getting it at discount.

2) You can still loose lot of money even if you buy stock at very low unit prices (e.g below 0,10 which may seem dirt cheap). The fact that unit price is in "penny stock" range is warning sign in itself. It means since listing of the stock things have gone badly south.

3) Worst possible thing can happen. The operating subsidiary of Talvivaara (Talvivaara Sotkamo Ltd) was declared bankrupt on November 6th, 2014.

Fortunately, I sold our Talvivaara positions in May 2012 and took severe losses from those. However, this was still before the end game and got some 2 euros per stock (which we were luckily investing into Nokia which did prove to be a lot better bet for turnaround).

Which reminds me of my tendency to keep too many turnaound bets at the same time.
That's never wise since the odds - in general and across many cases - are against spectacular turnaround (so you can expect to loose most of the time).

Anyhow, it's good to keep in mind that Talvivaara was far beyond exploration stage. Yet it failed completely. They had their first (and only) mine in ramp-up stage. And then too many things went wrong (including macro environment around mining industry translating to less demand & lower prices for all metals).

The other two I am about to discuss are exploration stage. That translates to much much higher risk than Talvivaara as Talvivaara made it to production. Very few exploration stage properties ever get that far.

- Think about it! -

I have used many times in my posts about Nautilus Minerals term "lottery ticket".

In June 2011, the estimate was that if all goes well production may commence on site at the Solwara 1 Project in the last quarter 2013.

Now, the estimate seems to be Q1 2018. Almost five years have passed and still production is approximately 2 years away.

Time is money. No wonder they need to raise money - again.
Compare the amount of shares now issued (~687 million) to the amount of common shares company has outstanding (~446 million) and to what they had outstanding in June 2011 (~156 million) and you get idea of how much stock has been diluted along the way. I can imagine this is very typical in this type of companies. But it also means your share of the potential "treasure" is getting smaller and smaller.

On the positive side, they are making progress with the production equipment and system.

I made some estimations back in 2011 about the revenue that could be extracted from Solwara 1.
The estimate was done with following metal prices.
Cu $9000/t, Au $1500/oz, Ag $35/oz, Zn $2200/t

Most of the value of the project lies in copper. The price of copper (Cu) is now under $5000.
Also Gold (Au) is below (now less than $1300/oz).

Any calculations I made about stock price level can be ignored (as company will much more shares at potential production stage than I estimated at the time).

Capital required to get into production has also ballooned over the course of the project.
I haven't looked at the latest prospectus on how much it's now.

The project is very risky. When in production they will have (to my recollection) only one production system. Any part of that system malfunctions and they are burning cash without producing.

Finally, let's look at the third example: Tasman Metals (TSX.V: TSM).

In mid 2013 things were still looking good. Tasman Metals was granted mining lease for it's flagship Norra Kärr heavy rare earth element (REE) project in Sweden. At that point in time the estimate was that mine construction could start late 2014 and produduction during 2016.

Didn't happen.

Recently Swedish Supreme Administrative Court canceled the Mining Lease for Norra Karr project. The company still holds Exploration License which it tries to extend. Tasman Metals have told they will curtail expenditure on the project and have decided not to renew exploration licenses for their smaller Swedish REE project (Olserum).


The stakes we once had in Nautilus Minerals and Tasman Metals have melted down to tiny ones.
I am keeping both for now for the fun of it. Until things start to look better in the mining industry as a whole, I do not want to increase our current (tiny) stakes in these companies.


Sunday, January 24, 2016

Berkshire back to portfolio

Berkshire Hathaway (NYSE: BRK.B) was added to portfolio after a long break.
I really like the management / investing style of Warren Buffett. It has taken Berkshire where it is today.

It looks favourably priced (P/E ratio near multi-year lows in mid January 2016).
In addition it starts to be near level (1.2x book) Warren Buffett has previously indicated to be the trigger for the formal share buyback program that should limit the possible downside.
The repurchase program is expected to continue indefinitely and the amount of purchases will depend entirely upon the levels of cash available, the attractiveness of investment and business opportunities either at hand or on the horizon, and the degree of discount from management's estimate of intrinsic value.
- Berkshire Hathaway, September 26 2011
You can find lots of analysis about BRK e.g. from Seeking Alpha (example).

The position was initiated by trimming down oil and telecom related positions.
The following ETFs were completely exited:
  • iShares Global Telecom ETF (NYSE: IXP)
  • Market Vectors Oil Services ETF (NYSE: OIH)
 

Saturday, January 2, 2016

Starting allocations for year 2016

Our portfolio is currently allocated as follows:

Stocks 97,9%
Gold 1,8%
Cash 0,3%


No bonds.
I simply substitute bonds with quality dividend payers in our portfolio.


Geographical Allocation (stocks):

Europe 61,2%
North America 25,8%
Emerging markets 13,0%


Actually, place of incorporation is pretty meaningless for most corporations we have invested in.
Most operate and sell globally.

Sector Allocation (stocks) - in order of weight in portfolio:
 
Information Technology (significantly overweight compared to even split across all chosen sectors)
Other
Oil & Gas Production
Low Emission Power Generation
Forest Industry
Communication Service Providers
Health Care
Metal Industry
Mining & Exploration (significantly underweight compared to even split across all chosen sectors)


Top 5 positions - in order of weight in portfolio:

Company/ETF (place of incorporation -- sector)

Siili Solutions (Finland -- IT)
Fortum (Finland -- Power Generation)
UPM (Finland -- Forest Industry & Power Generation)
Nokia (Finland -- IT)
Intel (USA -- IT)


26,7% of all stock positions are done via ETFs.
None of those positions made it to top 5 though.

Friday, January 1, 2016

Portfolio performance 2009-2015

It's time to compare the performance of our portfolio in the year 2015 against passive index investing.

Our "benchmark investment" is an imaginary passive ETF that closely tracks the performance of MSCI all country world (ACWI) index in euros.

This time I knew even before calculations that we would loose to the index.
The only question was how much.

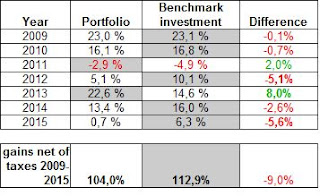
Our performance during 2009-2015 has been as follows:


The result for 2015 wasn't as bad as I feared, but it sure is disappointing to loose with such wide margin given both US and Finnish markets seemed to beat the ACWI index (most of our positions are in these markets). Clearly worst year yet in terms of difference to benchmark. Second worst in absolute performance.

Euro continued it's decline in 2015 from 1,2096 USD to 1,0858 USD (-10,23%). A bit smaller decline than 2014, but sizable nevertheless. Our portfolio is much more tilted to Europe and Eurozone than the ACWI index where U.S dollar exposure is currently 53% (source: XTF). This was one clear reason for loosing to the benchmark. However, clearly biggest reason is poor performance of many of our positions. Year 2015 continued to be bad for oil and mining sectors overall.

Cumulative gains of our portfolio (blue line) vs. benchmark investment (red line). 31.12.2008 = 100.

The difference to benchmark can be put better to perspective in a chart. It's actually amazing how closely we overall track the benchmark given that our portfolio has very different region & sector allocations compared to ACWI index.

Continuing with positive note, readers familiar with passive index investing know that most professional (very well paid!!) money managers and actively managed funds loose to their benchmark index over time. A recent CNCB article regarding active vs. passive investing gave interesting data points to think about:
"Morningstar data show that this year, through Oct. 31, roughly 58.6 percent of actively managed funds have failed to beat their benchmarks. And over the last 10 years, 73 percent of actively managed funds have fallen short."
While I use many passively managed ETFs, most of our positions are in individual companies. This combined with rather small yearly changes to the portfolio makes our portfolio kind of "passive-active" blend.

It would be plain dull to have fully passive portfolio (even though so far we would have been better served with that kind).


 Our benchmark index 2009-2015 (based on data from MSCI All Country World Index; Net; Euros)

If you want to know more about our "bechmark investment" and the way above comparisons are calculated, please read the latter part of portfolio performance update from 2014.